Property Location Evaluator
This tool uses Multi-Criteria Analysis (MCA) — a structured decision-making method that evaluates options across multiple factors simultaneously, rather than relying on a single measure like price alone. Each criterion is scored and weighted according to its relative importance, and the results are combined into a single comparable score per property.
Compare up to 6 properties across weighted location criteria. Scores update live as you fill in each section. Risk factors (flood, bushfire) are assessed separately from desirability and flagged with traffic-light indicators.
New to MCA? Learn more about Multi-Criteria Decision Analysis →
Score Comparison
Distance to the nearest train station on foot.
Distance to a useful bus route stop.
Distance to a CityCat or ferry terminal.
Ease of accessing a motorway or major arterial road by car.
Walking distance to a full-size supermarket.
Nearby IGA, corner store, or specialty grocer.
Quality of water views from the property or street.
Visibility of hills or mountain ranges.
Visibility of the CBD skyline.
Walking distance to a usable park or reserve.
Proximity to a cluster of cafés or dining options.
Walking distance to a gym or fitness facility.
Walking or short driving distance to a primary school.
Proximity to a high school or college.
Check Queensland flood mapping (floodcheck.com.au). 'Confirmed no risk' means the property is outside all flood zones.
Check Queensland bushfire mapping. 'Confirmed no risk' means the property is not in a bushfire-prone area.
How Scoring Works
Desirability Score
Each criterion is scored based on your selection. Scores are grouped by category, weighted, and combined into a percentage. Unknown answers are excluded from the denominator — your completeness indicator shows how much data has been entered.
Risk Assessment
Flood and bushfire risk are assessed separately and shown as traffic-light indicators. A high desirability score cannot offset a confirmed risk — both dimensions are always visible.
Mandatory Criteria
You can mark any criterion as Mandatory, Important, or Optional. If a property scores zero on a mandatory criterion, a warning is shown even if the overall score is high.
Sensitivity
The sensitivity panel shows whether the top-ranked property would change if any single category's weight was doubled — helping you understand how robust the ranking is.
About Multi-Criteria Analysis
MCA is widely used in infrastructure planning, investment appraisal, and policy decisions precisely because real-world choices involve trade-offs — a property might score highly on transport access but poorly on views, and MCA makes those trade-offs explicit and transparent. The chart below illustrates a typical MCA output: options plotted against cost and total score, with bubble size representing a third dimension such as risk or scale.
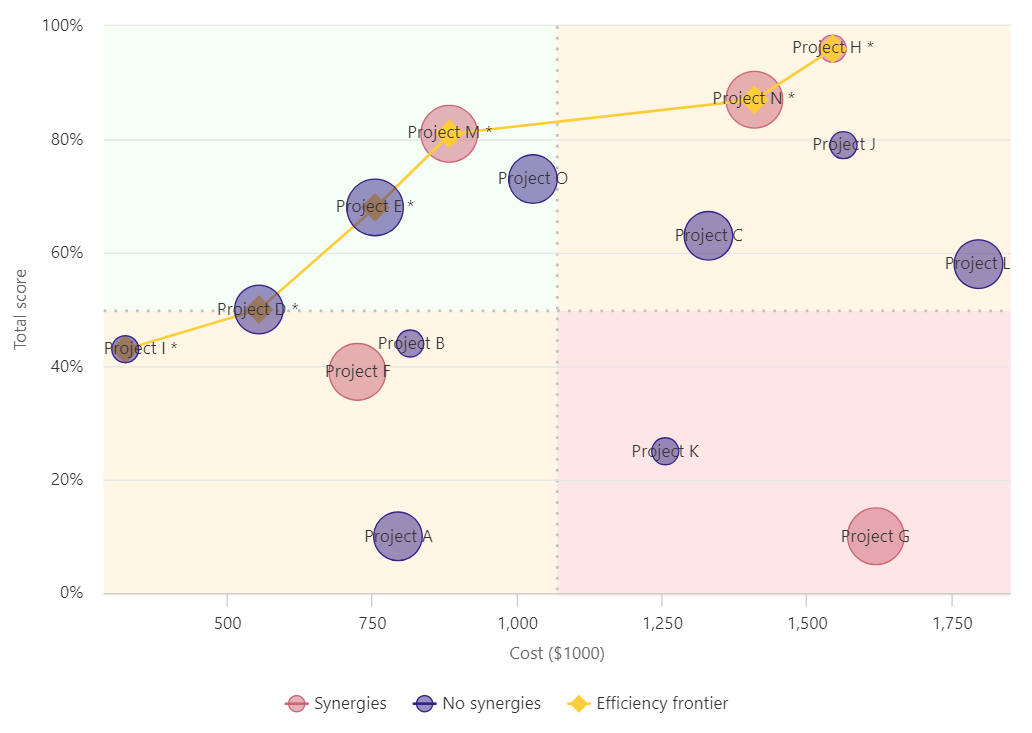
Example MCA output — options plotted by cost vs. total score. Bubble size represents a third dimension (e.g. scale or risk). The efficiency frontier (gold line) connects the best-value options at each cost level.